How to Rate Partners in Logistics on basis of Performance
A. Introduction
This is an internal guidance mechanism to ensure that the partners who are highly rated are given much bigger opportunities for doing business with their companies and are also given better preferential treatment .
Rating of a partner can be done based on certain criteria’s like partners performance in order for example the time taken to complete the order, income the partner generates, how often the partner gives the orders.
Approach:
EDA:
1. Checking the distribution of each feature.
2. Normalizing the all feature.
3. Checking the percentile of each column.
Feature selection/engineering :
Binned the data by looking at the percentile and assigning individual rating
Business rule:
Give weights to each feature based on the business needs and calculating the overall rating.
B. Rating the customers :
Checking the distribution of each features
Profit.
Payment days.
Loading/ offloading delays.
Business offered.
1. Profit – how much profit partner is generating for the company.
Steps:
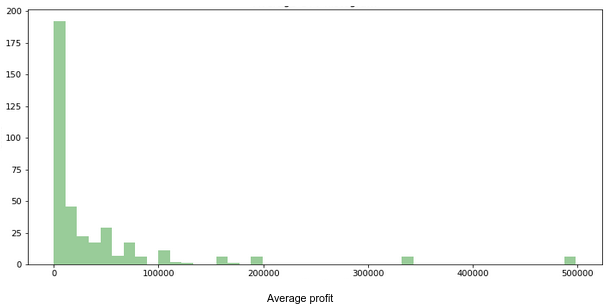
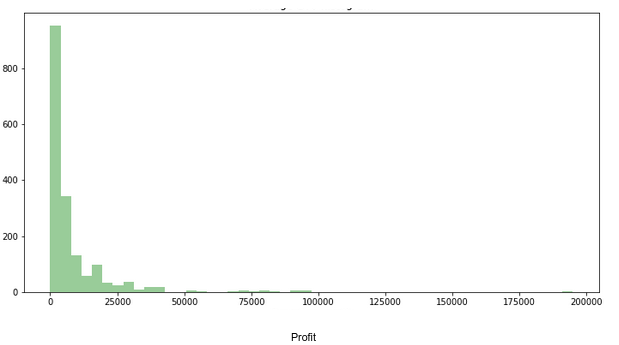
Checking distribution of Profit.
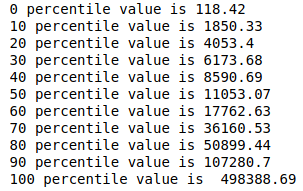
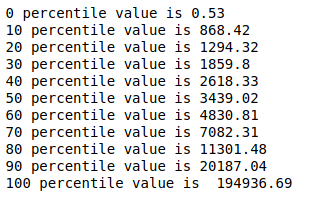
Checking percentile.
Binning and giving rating labels.
By looking at the plot we are not able to bin the data so we see the percentile so as to create bins.
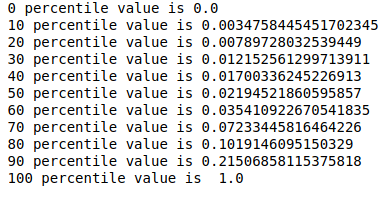
By looking at the percentile we see the range is too high so we normalize the data using scikit learn library called minmax_scale.
Now again checking the percentile.
Binning the data and setting the range by
Now we have a rating according to the profit the customer gives.
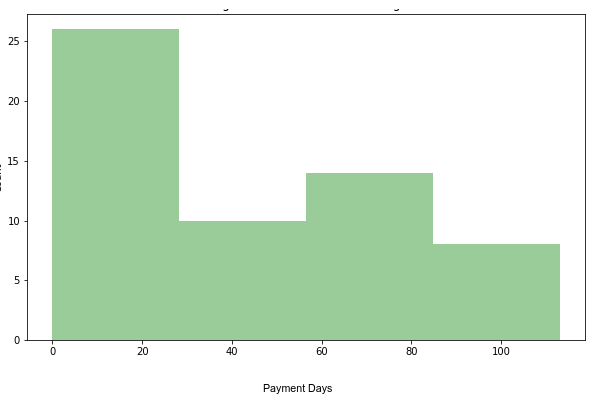
2.Payment days
Repeating the same process checking the distribution
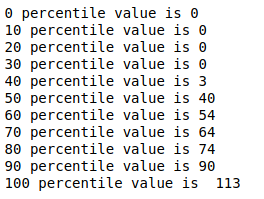
We check the percentile of the data
By looking at the percentile we bin the data and give the rating
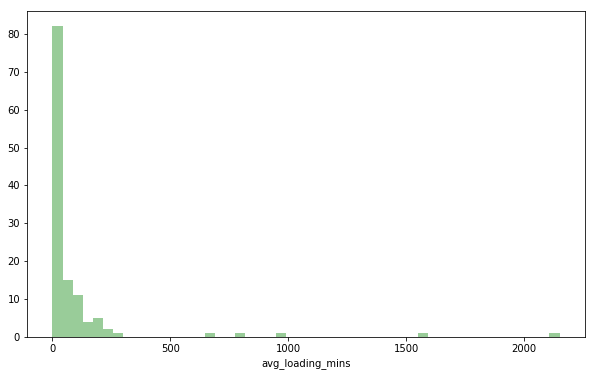
3.Loading delays :
Checking the distribution of delays while loading the goods.
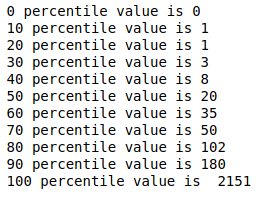
checking the percentile :
By looking at the percentile we give the rating to partner for his/her loading delays
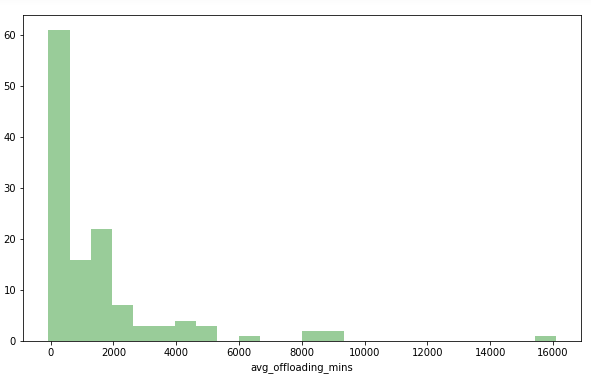
Offloading delays : how long partner takes to unload the goods
checking the distribution of offloading delays
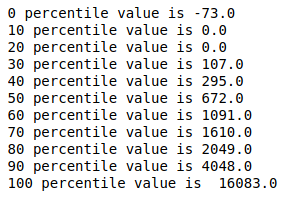
Now checking the percentile
By looking in percentile we can see that there are outliers in the data so we consider bin from negative so as to handle the outliers.
So now we have a rating of offloading delays based on the percentile.
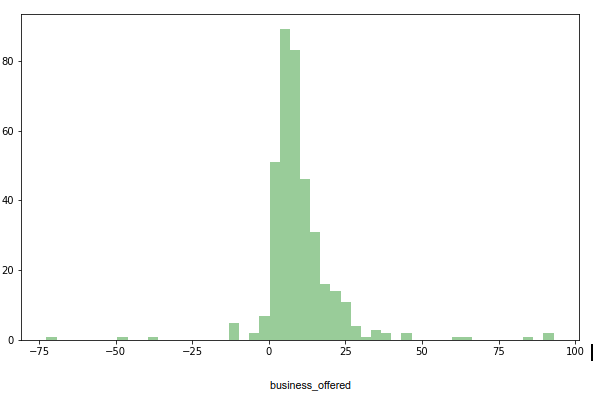
4.Business_offered: how often partner gives order to company
Checking the distribution for take rate
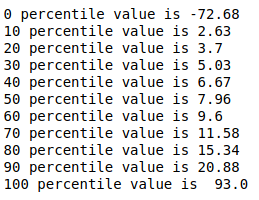
Now checking the percentile for more information
We see the business offered is negative for few partners by looking at the percentile we give rating.
Now we have a rating for business_offered.
Now we are having ratings for all the features which were important for business. So now we have to derive the weighted average according to business needs.
We supply weights according to business requirements which means which feature is more important we give more weights to that particular feature.
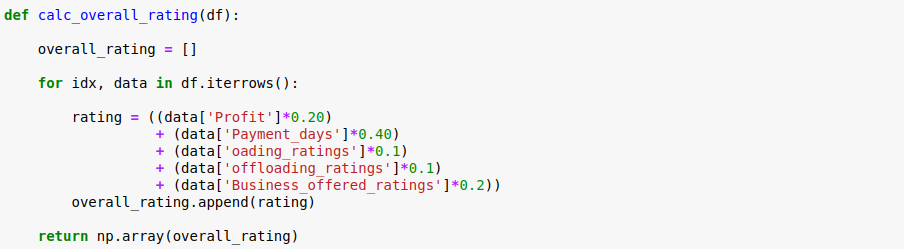
C.Formula for weighted average :
Weighted rating = ((feature_01 x 0.20) + (feature_02 x 0.20) + (feature_03 x 0.20) + (feature_04 x 0.10) + (feature_05 x 0.30) )
Note : weights are given according to the importance of the particular feature.
By this formula we derive a rating for each individual and store it in a new rating column.
D.Rating the transporter:
Profit_ratings – profit transporter makes for company per month
Vehicles_owned_rating – No of truck transporter owns
vehicle_usage_rating – how long transporter has been using the truck
delivery_confirmation_ratings – confirmation he sends after delivery
ETA_ratings- delivery time
accident_Rating – no of incident transporter make during the trips
1. Profit :
Checking the distribution by repeating the same process as we did for customers
As we can’t inference much we check the percentile
After checking the percentile the range is too high so we normalize the data for transporter gtv and bin the data accordingly.
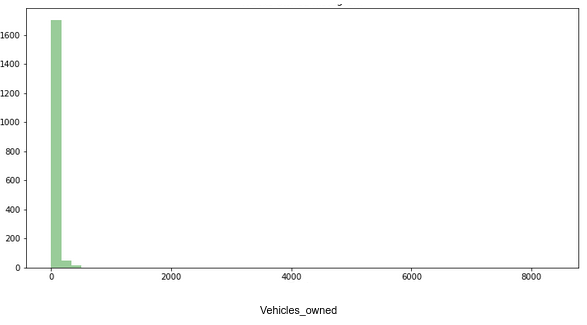
2. Vehicles_owned_rating
Checking the distribution of the data.
Checking the percentile
By looking at the percentile we bin the data
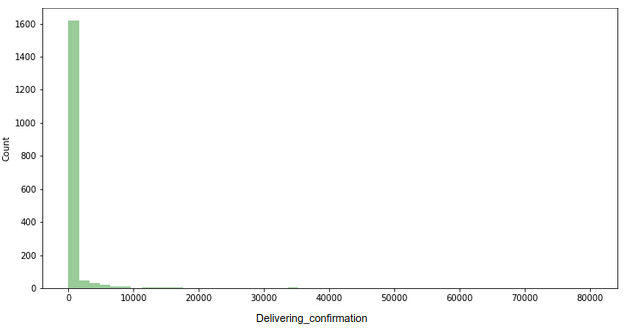
3. Delivery_Confirmation
checking the distribution
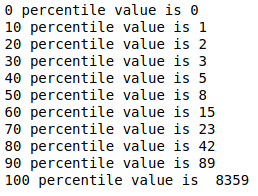
checking the percentile
Looking at the percentile we bin the data
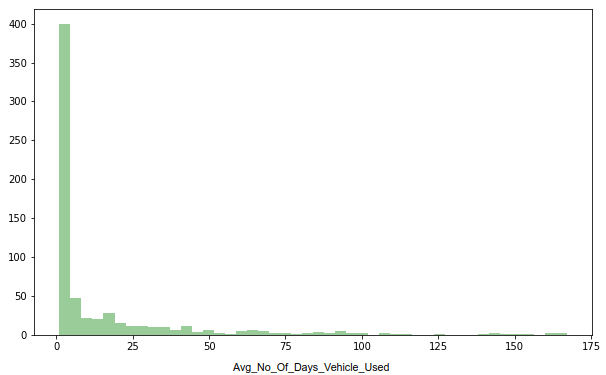
4. Vehicle_usage_rating – avg of all vehicles for specific transporters.
Checking the distribution
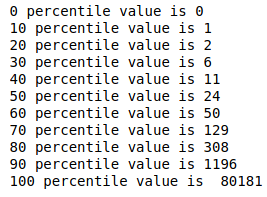
Checking the percentile
Binning the data according to percentile
5. ETA history- time duration in completing the trip
Directly checking the percentile as it for time data
Binning the data by percentile
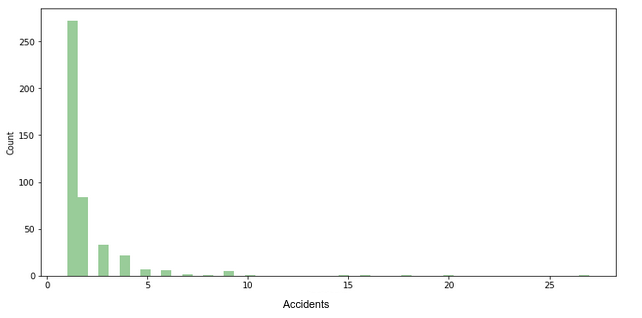
6. Accident history – how many Accident transporter has done
Checking the distribution
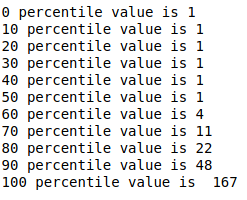
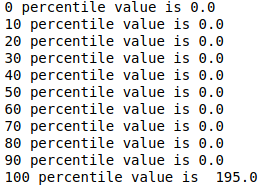
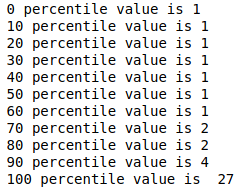
Checking the percentile
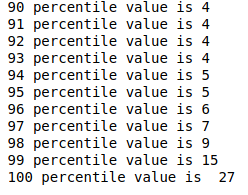
Looking too 90 to 100 percentile for more clarity
Binning the data after looking at the percentile
Now we have rating for all the important features
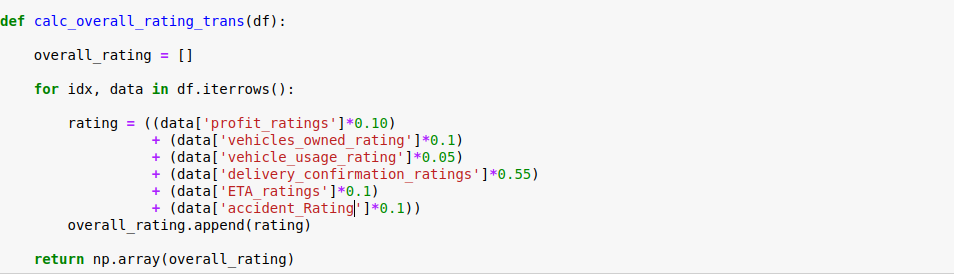
E.Using the same weighted average formula
Weighted rating = ((feature_01 x 0.20) + (feature_02 x 0.20) + (feature_03 x 0.20) + (feature_0 x 0.10) + (feature_0 x 0.30) )
F.Conclusion
Now we derived an overall rating for each transporter and customers based on the weights given in the scorecard according to the business needs. And after the rating is generated we sort the output by that we will be able to see all top performing partners and give them special treatments and also help the underperforming partners as well.
We simply solved the problem by simple data science technique and not using any machine learning model. By using a combination of scorecard, input ranges and weights, the ranking of customers was derived with a very high level of accuracy.This has helped the client to focus on areas where improvement is required and also to make efforts for retaining the high value customers.